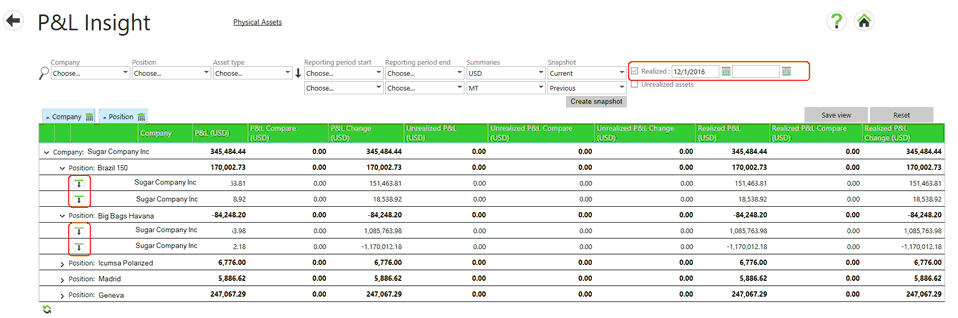
The P&L Insight screen shows both realized and unrealized assets by using different filters. Users can compare the P&L of any daily snapshot with that in any other daily snapshot, both on a summary level and in the drill down level of individual assets.
The usage of the P&L Insight screen is completely the same as the Mark to Market screen. Both screen have search filters at the top of the list and links to look at assets per position. The difference is that the P&L Insight default search is for realized assets of the current month, while Mark to Market default search is for unrealized assets.
Loading Data
Selecting the P&L Insight tile from the Home screen will not automatically load data when you first access it. Instead, the screen will open and the table headers will appear, but you must select the search button ![]() to have data load. This allows you to first select different filters before data is loaded into the table.
to have data load. This allows you to first select different filters before data is loaded into the table.
A list and definitions of all columns available for display on the screen is available in this guide in the Mark to Market Data Definitions section.
Like on the Mark to Market screen, users can modify the view to their preferences and save it as their default view. They can:
- indicate which columns to display (right click the column headers),
- change the order of the columns (drag a column),
- group the data by specific columns (drag a column),
- sort the data (click a column header or group header)
Filter Fields
These are located at the top of the P&L Insight table. Selecting an option in a field and then using the search button executes the filter. A filter can be reset by choosing other options or exiting the screen. The following filters are available and may be used in any combination:
| • | Company - all internal companies to which you have permission to see. |
| • | Position - all positions from Master data. |
| • | Asset type - all specific asset types including physicals ( physical, stock and floating assets), Future, Invoice, Option or OTC. |
| • | Reporting period start - Year and month to start filtering for a specific reporting period. |
| • | Reporting period end - Year and month to stop filtering for a specific reporting period. If nothing is entered, it will take the current year/month. |
| • | Summaries - allows you to select the currency and the quantity unit that will be displayed in the P&L Insight table. |
| • | Snapshot - Lists all available snapshots of P&L data that has been saved for a particular date. Two snapshot dates may be chosen for comparison. |
| • | Realized check box - includes realized data in any filter. The two date fields next to the check box may be used to define specific realized dates. This is the default filter type for the P&L Insight screen. The first date will default to the first day of the current month. |
| • | Unrealized assets check box - includes unrealized assets in any filter. |
Data Sorting
Data may be sorted (acceding/descending) by selecting a column header. A small triangle will appear in the column header indicating that the data is sorted on that column and in which way it is sorted. Selecting the column again will sort data in the opposite way. The the reporting period and future period are in chronological order, not alphabetical order.
Data Grouping
Data can be grouped by selecting and dragging a column header above the list. A blue tab will appear on top of the list and the data will grouped in the order of the tabs starting at the left. Groupings may be deleted by selecting the Delete button on the tab.