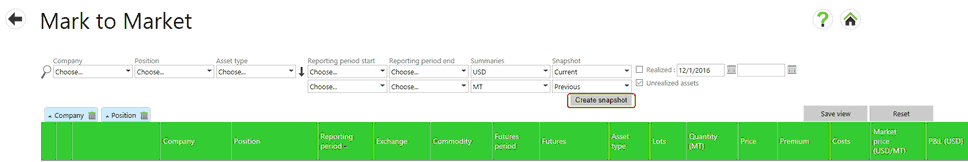
You can create daily snapshots of all the data in the Mark to Market module as well as market data for the snapshot date. Previous snapshots can also be viewed. This allows you to see a daily progression of P&L across time.
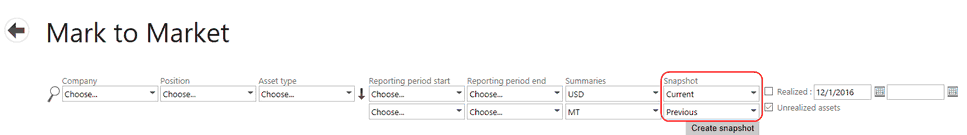
Snapshots are created using the Create snapshot button on the Mark to Market or P&L Insight screen.
| • | You must have the "Create snapshot" permission to view and use the Create snapshot button. |
| • | Data does not need to be loaded in the screen to create a snapshot. Selecting the Create snapshot button will automatically capture all data used in a snapshot. |
| • | Only one snapshot per date is allowed and weekend days are excluded. |
| • | An existing snapshot for the current date gets overwritten if a new current snapshot is created on the same day. |
| o | Important note: If you create a snapshot on a Saturday or Sunday, it will overwrite the data from Friday. |
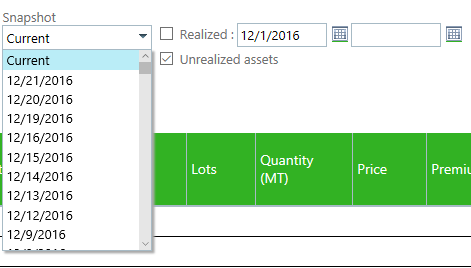
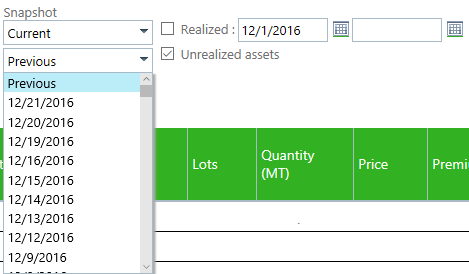
Once a snapshot has been created, you can choose a snapshot date from the available snapshots in a drop down box under the Snapshot column. This includes any "Current" snapshot you may have just created. To view the Snapshot data, click the search button ![]() and the screen will then show the data from the snapshot selected.
and the screen will then show the data from the snapshot selected.
|
|
On a summary level grouped by position users can see the 3 summarized values of the realized, unrealized and combined P&L for both snapshots as well as the change between the 2 snapshots. So for each of these 3 P&L values you can choose to see 3 different values:
| • | the value for the main snapshot, |
| • | the compared value for the other snapshot, |
| • | and the change between the 2 snapshots. |
So in total these are 9 columns with P&L information:

On the drill down level of individual assets:
| • | Users can see these same 9 columns for the individual contribution of every asset to the P&L values and to changes in the P&L values. |
| • | By clicking on any individual asset users can open a fully detailed field level comparison of that asset with the same asset in the compared snapshot. |
| • | In case an asset exists only in 1 of the 2 snapshots you will see that it is 0 valued in the other snapshot. |
All this data can be downloaded into an Excel file for further analysis. To support analysis, 2 more columns have been added to this export:
| • | the snapshot date – this allows you to easily combine multiple snapshot exports in one file and create a pivot table across data sets from different snapshots. |
| • | the realization date – this allows youto see the date the asset is marked as realized (which is not necessarily the same as the date on which the realization was recorded in the administration, e.g. execution dates are often in the past). |