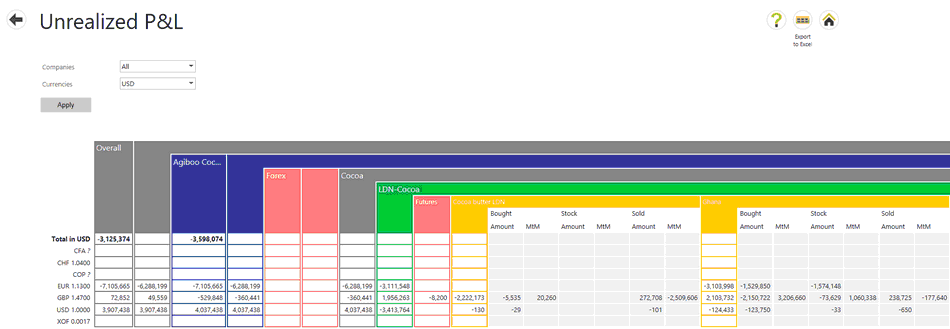
The Unrealized P&L module is a screen shows a variety of values. On the left, the currency and the most recent rate is shown. The remainder of the values is grouped using colors starting from the left as follows:

First Column - Gray |
Overall totals |
||||
Blue |
Values per internal company. |
||||
Red |
Forex Red columns next to a blue column are Forex values. The first column with the Forex label shows Forex contracts which have not yet matured in the Internal company currency (converted from the original reporting currency). The second red column without a label displays values in in the internal company reporting currency. |
||||
Gray |
Values per commodity groups. Commodity groups are displayed in alphabetical order. |
||||
Green |
Values by futures instruments. |
||||
Red (within the green group) |
Futures |
||||
Yellow |
Values for Positions, recorded separately under the headings Bought, Stock and Sold.
|
The different currencies are displayed as rows under all these columns. The first column totals the values in the currency selected under the filter.