The current Dashboard functionality consists of 6 chart types.
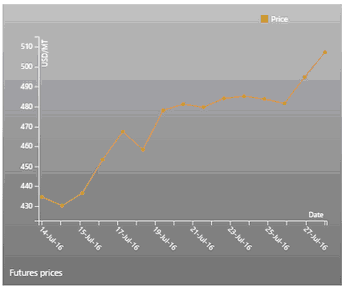
Futures prices chart |
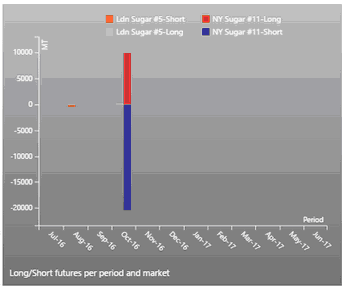
Futures position chart |
|
|
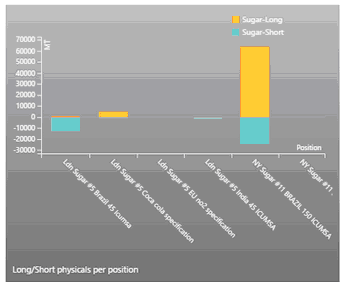
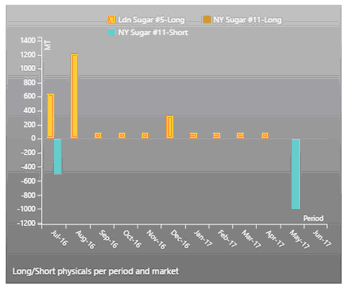
Physical position chart |
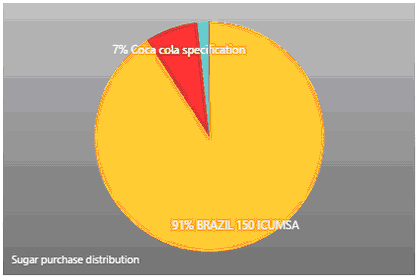
Physical position distribution chart |
|
|
Position chart |
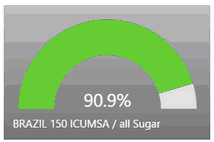
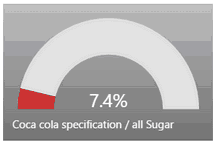
Physical position gauge
|
|
|
Other Information
| • | There may be multiple versions of one chart on a Dashboard depending on the Position data configuration. |
| • | If a site has no open contracts (undelivered), the charts on the left and middle will stay empty. |
| • | If a site has no more than 1 position on 1 commodity, the 3 charts in the middle will all be on 100% |
| • | If the site has no market prices for futures the last chart stays empty. |
| • | If a site has no 2nd commodity or has no sales contracts entered for a second commodity, a pie chart showing commodity sales will be blank. |
| • | If you stay on the screen, most chart data refreshes automatically. Example - if you cancel a big contract, the bar chart at the left top will adjust automatically. |
| • | If there are contract or Mark to Market changes, there may be a slight delay for Agiblocks to update the Dashboard screen information. |
| • | Dashboard information may be updated by using a browser's refresh command. |